


Do Student Ratings of School Climate Predict School Outcomes in Urban Alternative High Schools?
Abstract:
This research examines the relationship between student ratings of school climate and three student outcome variables: Number of credits earned in one semester, number of days in attendance in one academic year, and number of discipline referral incidents in one academic year. The research further examines whether these relationships were moderated by school type. Data were disaggregated by traditional and three types of alternative schools (i.e., innovative, academic remediation, and behavior-focused). Results indicate that the predictive power of school climate is moderated by school type, thus school climate is not uniformly predictive of school outcome. Implications of findings are discussed.
Keywords: alternative education, school climate, school achievement, school outcome, special education
School climate is broadly defined as the quality and character of school life, as perceived by stakeholders in the educational process (e.g., students, teachers, and community members) (National School Climate Council, 2007). There are multiple dimensions—or experiences—related to school climate, such as perceptions of safety and academic preparation (Maxwell et al., 2017). A substantial and growing body of research indicates a positive school climate (e.g., one in which participants view school favorably) is critical to high quality academic programing and effective behavior management (Freiberg, 1999; Hoy et al., 1991; Maxwell et al., 2017; Sanders et al., 2018; Sterbinsky et al., 2006; Thapa et al., 2013). As school districts adapt to student needs, some—especially large, urban districts—offer unique, alternative educational settings. For example, many urban districts operate innovative learning schools focused on a specific topic area or pedagogy (e.g., performing arts high school). Concurrently, these districts provide non-traditional students (e.g., young mothers) and students with remedial academic or behavior needs with individualized placements theoretically designed for them. Although a significant body of research exists dedicated to school climate, little to no empirical attention is given to the unique climates of alternative schools and other non-traditional placements in urban school districts.
School climate is a focal point in efforts to boost student performance. For example, the Centers for Disease Control and Prevention (2009) identified positive school climate as a protective factor that encourages students’ connectedness to their education and desire to be in school, both of which are predictive of school completion (e.g., Fatou & Kubiszewski, 2018; Stewart, 2008; Yang et al., 2018). Significant evidence links school climate to academic and behavior outcomes, with effects extending to students with disabilities and English Language Learners, who are considered most at academic risk (Davis & Warner, 2018; Sanders et al., 2018). Indeed, numerous scholars assert that without a positive school climate, a high degree of student success is unlikely (e.g., Cohen et al., 2009; Hoy & Hoy, 2006; Hoyle et al., 1985). Further, some research identifies positive school climates as powerful enough to relieve many of the negative learning consequences of poverty in urban communities (e.g., Edmonds, 1979).
Previous research suggests positive climates predict lower rates of problem behavior. For example, schools with climates that are rated more positively by students and staff report fewer incidences of student misbehavior and the resulting office referrals (Cohen & Geier, 2010; Lee et al., 2011; Sugai & Horner, 2002). Specific reductions in misbehavior include fewer instances of aggressive and antisocial behavior (Gregory et al., 2010), fewer episodes of bullying and harassment, (Konishi et al., 2017; Yang et al., 2018), and fewer reports of in-school violence (Lindstrom-Johnson et al., 2017). In turn, reducing instances of problem behavior predicts better student outcomes, such as improved attendance and academic achievements, (Bradshaw et al., 2009; Luiselli et al., 2005; Netzel & Eber, 2003).
This empirical evidence reflects that which scholars have long posited: Students succeed when the environment around them promotes their success. Throughout the past century, educators recognized that the school environment and perceived climate are important determinants of the quality of students’ schooling experiences (see Anderson, 1982; Durkheim, 1961; Perry, 1908). Our research examines how school climate is linked with student achievement within the contexts of differing school types. Specifically, we addressed the following research questions: (1) Is there a relationship between student ratings of school climate and the number of credits earned in one semester, number of days in attendance in one academic year, and number of discipline incidents in one academic year?; and (2) Does type of school enrolled moderate the effect?
Though researchers have long recognized the importance of school context (e.g., Durkheim, 1961), today that context is more varied than ever before. School districts, especially in larger metropolitan areas, operate a variety of high school settings. Districts still maintain comprehensive neighborhood schools, generally referred to as traditional schools. Students often attend traditional schools by default based on geographic boundary. For example, students living on the west side of town would typically be assigned to West High School. Many urban districts also offer alternative education in the form of alternative schools in which specific and targeted curricular content (e.g., STEM) or pedagogy (e.g., cooperative learning) are employed to reach students with academic or behavioral needs unmet in the traditional setting. Students do not attend alternative schools based on proximity; rather, students are referred or self-select them (Raywid, 1994). Some alternative schools serve students who are unsuccessful or disenfranchised with traditional schools, while other alternative schools aim to reach students with particular skills and offer innovative, subject-bound approaches to learning (e.g., high school of performing arts).
Our conceptualization of alternative schools is based on prior research conducted by Perzigian et al. (2017) and Raywid (1994) who categorized alternative schools into three specific types: Innovative alternative schools (schools of choice), behavior-focused alternative schools, and academic remediation-focused alternatives schools. Alternative schools of choice focus on particular content or pedagogy. Enrollment in these schools often require a rigorous application process, demonstration of skills, and gained acceptance in order to attend them. Students do not typically enroll due to academic or behavioral failure. Raywid (1994) described these schools as innovative due to their association with novel and unorthodox teaching approaches, such as experiential learning, which was uncommon in traditional neighborhood schools during the free school movement of the 1960s (upon which alternative education today was founded). For our research, we followed Perzigian et al. (2017) and labeled alternative schools of choice as innovative alternative schools because of their continued association with innovative (e.g., unique) teaching pedagogy and curricular focus uncommon in traditional neighborhood schools.
Conversely, alternative schools to which students are referred, often without choice, focus on modifying challenging behaviors or providing opportunities for academic remediation (e.g., credit recovery). Schools to which students are referred for challenging behavior are called behavior-focused alternative schools. The aim of these schools is primarily behavior modification and may be a student’s final option (i.e., last chance) before expulsion from a district. For example, students are often referred due to frequent minor behavior infractions (e.g., noncompliance or disrespect) or severe behavior incidents (e.g., fighting, or other antisocial behaviors causing injury). A third and final type of alternative school is that which provides academic recovery for students who are credit deficient or are otherwise academically at-risk (e.g., chronic absence). The priority is individualized and small group instruction aimed to remediate any performance or credit gaps (e.g., credit recovery programing). We refer to these schools as academic remediation-focused alternative schools. It is important to note that unlike behavior-focused alternative schools, academic remediation-focused alternative schools do not serve students for disciplinary reasons.
Most research studies investigating perceptions of school climate and the consequences of positive or negative school climates do not explicitly identify the type of school (i.e., traditional or alternative) in which the research occurred. In fact, a search of school climate studies across K–12 settings located only one study in which climate specifically in an alternative school was discussed (see Wisner, 2014). Thus, little is known empirically about the school climate experiences of students enrolled in the different types of non-traditional placements. Research suggests that positive school climate is particularly important for the success of students who present academic or behavioral difficulty (Cohen et al., 2009; Felner et al., 1995; Haynes et al., 1997; Sanders et al., 2018). Considering alternative education serves youth at risk of school failure or who are disengaged in traditional schools, it is critical to examine perceptions of climate in placements that cater to disengaged youth and to evaluate the connections between climate and school outcomes.
Methodology
The three outcome variables analyzed in this study were: number of credits earned in one semester (the district in which the study occurred utilized a two semester system, and all classes are weighted equally within the district high schools) of the 2012–2013 school year, number of days in attendance (reported as percentage of the 2012–2013 school year in attendance), and number of discipline referral incidents during the 2012–2013 school year. The study sought to determine if these academic and behavior outcomes vary in relation to ratings of school climate by and across school types. These specific outcome variables were chosen because of their wide dependency in school climate literature to measure the impact of positive or negative climates (e.g., Cohen et al., 2009). Unlike most previous research of this type, the present investigation disaggregated data by school-type and examined three different categories of secondary alternative settings (i.e., innovative, behavior-focused, and academic remediation-focused) as well as one category of secondary traditional schools. A traditional school is defined by default enrollment through boundary or catchment area.
This study relies on data from two datasets provided by the sample school district. The first dataset consisted of student responses to the 2012–2013 District School Climate Survey. The District School Climate Survey is provided to students annually with the purpose of measuring four dimensions of school climate (i.e., rigor, environment, safety, and governance) and total climate. The second dataset utilized in this study consisted of de-identified student-level data (i.e., attendance, credits earned, and discipline referral incident count data) for the academic year 2012–2013. To prepare the data for analysis, school climate and outcome data were merged and aggregated by school to create a single dataset that treated each of the 48 schools in the study as a case. School-level data included information about each school’s type (e.g., traditional or specific alternative), measures of school-level academic and behavior outcomes (i.e., attendance percentage, credits accrued, and discipline incident count data), and aggregated school climate ratings from students.
District Setting
The sample district was chosen for three reasons: its urban setting, its size (it is the largest school district in the state), and the district’s use of alternative placements. The multitude of different alternative schools utilized by the sample district provided a necessary context for our research questions; to address specifically the school climates in alternative schools, the sample district for the study needed to employ several alternative schools within Raywid’s (1994) three categories. Further, the one traditional and three types of alternative schools studied cover all the school types offered by the sample school district. Census data indicates the sample school district is located in a city of approximately 750,000 residents with a poverty rate of 20–25% and a median family income of $35,000–40,000. African American residents are the largest racial group at 40%, followed by White at 38%, and 17% Hispanic or Latino. Approximately 70,000 K–12 students are served by the sample school district each year. The state education agency (SEA) indicates 85% of the students are economically disadvantaged (i.e., Free or Reduced Lunch status). At the time of data collection, approximately 23,000 secondary students were enrolled in the district’s high schools and approximately 3,500 staff were employed in the district’s high schools. Four types of schools were coded and examined in this study: traditional schools, and innovative, behavior-focused, and academic remediation-focused alternative schools (see Perzigian et al., 2017, and Raywid, 1994, for the protocol used to categorize schools). Raywid (1994) identified all three types of alternative schools as most common in urban environments and integral to the success of students in large school districts.
Dataset 1: School Climate Data
Ratings of school climate were obtained from a dataset containing results from the 2012–2013 District School Climate Survey. Items for the survey were created by the district with guidance from a commercial climate survey instrument (see Sebring et al., 2006). The format of responses to items measuring school climate was originally a five-point Likert scale anchored as follows: 1 = strongly disagree, 2 = disagree, 3 = agree, 4 = strongly agree, and 5 = not sure. Because the rating of not sure is designed to allow participants to not answer the question if they are unable, we considered answers of 5 to be missing data and removed those responses from analysis. Thus all data fell along a 4-point scale. The aim of the survey is to provide administrators and district personnel with stakeholder perspective regarding four specific dimensions of school climate: rigor, safety, environment, and governance. At the time the climate survey was conceived, the district’s director of assessment elected to focus on these four climate factors (i.e., dimensions) for the survey as they represent priority areas in the literature and measurement instruments (see Sebring et al., 2006).
Indeed, all four climate factors assessed by the District School Climate Survey are widely recognized in various school climate literature. Each climate factor is specifically defined on the survey instrument: rigor is “having academics as a priority and having high academic standards;” safety refers to “the physical atmosphere, including facility upkeep, as well as discipline;” environment is “the general atmosphere of the building and those in it as a supportive place to work and learn;” and governance is “the atmosphere of inclusiveness and strong leadership in decision-making.” The District School Climate Survey definitions of these four climate factors align with work conducted by Sebring et al. (2006) at the University of Chicago. An example of a student survey item rating the rigor dimension is, “students in my school focus on learning;” an example of a student survey item rating the safety dimension is, “I feel safe at my school;” an example of a student survey item rating the environment dimension is, “my school has a friendly and welcoming atmosphere;” and an example of a student survey item rating the governance dimension is, “I have the opportunity to help make decisions about my school.” The number of students who completed at least some portion of the school climate survey was 10,866 and the approximate response rate was 50%.
Missing Data
As noted above, participants were given the option to answer not sure to any item; this is done to avoid forcing a response when a participant is unsure how to answer it. We elected to treat 5 = not sure as missing data, as there is no reasonable way to include this item in a Likert scale that addresses level of agreement with statements. For students, there were a total of 5,701 not sure item responses that were removed.
The next question we considered was how many items a participant needed to answer for their response to be included in analysis. It goes without saying that a participant who answered all items should be included, and a participant who answered no items cannot be included, but what about participants in between? There is no universally recognized criterion for determining how much missing data is too much, but Warner (2008) posits that cases with substantial amounts of missing data should be removed prior to running statistical analyses. Given the lack of specific guidance, we decided to exclude participants who responded to fewer than 80% of the school climate survey items. In our judgment, these participants were either too unsure on the items presented for us to feel confident we can summarize their responses, too disengaged with the survey to bother filling it out, or a combination of the two. Using this standard, students had to answer at least 15 out of 18 climate items. We were able to prioritize responses from participants who completed 80% of more of items because of the large amount of data available: Even after this exclusion, there remained 8,694 (80.01%) cases available for school climate analyses. Prior work by Perzigian & Braun (2020, 2021) with the sample district utilized the same exclusion criteria.
Survey Scoring
Climate subscale scores were calculated by averaging responses to items composing those subscales. However, in the case of the student governance subscale, which was represented by a single item, responses to that single item were used as the governance subscale score. In order for a subscale score to be calculated, there could not be any missing data relevant to that subscale. For example, if a student was missing a response to one or more of the items in a dimension, we didn’t compute a dimension score for that student. The reason for this decision was that most dimensions were represented by only a few items to begin with, so missing data on even one item presented a challenge to the validity of the dimension score. However, that student could have had, and most often did have, dimension scores for the other dimensions. Overall school climate scores were calculated by averaging responses to all available climate items in the survey. Thus, as many as three or four climate survey items could be missing, but as long as participants responded to at least 80% of the climate items, an overall climate score was calculated. As discussed further in this chapter, only overall climate scores were analyzed to address the research questions.
Data Screening
School climate data were screened for outliers by standardizing total climate scores and identifying cases with z-scores exceeding ±3.0 (Meyers et al., 2013). All climate data for these cases were considered extreme and unreliable and were deleted. Among students, 92 cases were deleted, leaving 8,602 cases (79.16%) for subsequent analysis. The decision to exclude cases based on extreme scores is a difficult one. In a large dataset such as this one, and given the population from which participants are drawn, we exclude these extreme scores as a hedge against the possibility that a participant may not have read the items carefully or given their responses due consideration. For example, a student who dislikes their school may have chosen to strongly disagree with all items because of this feeling.
Dataset 2: Student Demographic and Outcome Data
This second dataset was comprised of de-identified student-level data for 12,427 secondary students in the sample district and includes school attended, demographic information, and student academic and behavior outcome data. The student outcome data included 47 schools with 12,427 students reporting attendance data, 47 schools with 12,427 students reporting incident count data, and 46 schools with 11,437 students reporting credits earned data. Specifically, the outcome variables examined in this study were: (a) attendance rates for the 2012–2013 school year for each student in the sample, expressed in percentage form (missing 40% or more of one school day is reported as one absence), (b) the number of high school credits earned in one semester by each student in the sample during the 2012–2013 school year, and (c) the number of discipline referral incidents each student received during the 2012–2013 school year. A discipline referral incident occurs when a student is documented for committing a behavioral infraction (e.g., breaking a rule). The demographic information included: (a) gender, (b) special education status, including individual disability category (SPED), (c) free or reduced lunch status (FRL), and (d) race for all students in the sample.
Demographic Data
Table 1 provides a summary of the demographic characteristics of the 12,427 students in the study. The demographic proportions in the sample are approximately representative of the total district. Sample sizes and composition vary in subsequent analyses due to missing data. Student ages ranged from 12 to 20, with a mean of 15.74 years and standard deviation of 1.25. The single student aged 12 in the study attended an innovative alternative school.
Outcome Data
Attendance, number of credits earned, and number of reported discipline referral incidents were chosen for use as outcome variables because they are common measures for assessing student performance and progress. Attendance is a predictor of attachment and investment to school (e.g., Somers & Gizzi, 2001). Earning credits is required for grade promotion, for graduation from secondary school, and represents satisfying school academic expectations.
Table 1
Demographic Characteristics of Students in the Study
|
Demographic Variables |
N |
% |
|
Current Grade Level |
||
|
9 |
4,516 |
36.3 |
|
10 |
2,891 |
23.3 |
|
11 |
2,877 |
23.2 |
|
12 |
2,143 |
17.2 |
|
Gender |
||
|
Female |
6,109 |
49.2 |
|
Male |
6,318 |
50.8 |
|
Race |
||
|
African American |
7,521 |
60.5 |
|
Hispanic or Latino |
2,592 |
20.9 |
|
White |
1,549 |
12.5 |
|
Asian |
688 |
5.5 |
|
Native American |
77 |
0.6 |
|
FRL Status |
||
|
FRL |
9,153 |
73.7 |
|
No FRL |
2,467 |
19.9 |
|
Reduced |
807 |
6.5 |
|
Special Education Status |
||
|
No Disability |
9,544 |
76.8 |
|
Yes Disability |
2,883 |
23.2 |
|
School Type Attended |
||
|
Traditional |
4,960 |
39.9 |
|
Innovative |
6,695 |
53.9 |
|
Behavior-Focused |
76 |
0.6 |
|
Academic Remediation-Focused |
696 |
5.6 |
|
Total |
12,427 |
100 |
Note. FRL = Free and reduced lunch.
According to the SEA in the state in which the present study was conducted, number of credits earned each year is also used to determine whether students are considered at risk for school failure or dropout and can be a factor in the referral of students to alternative settings. Lehr and Lange (2003) and Raywid (1994) noted that lacking credits is a primary reason students transition to alternative school placements. Frequency of discipline referrals is an indicator of school-wide behavior problems and may represent degrees of safety (a dimension of climate) perceived by students in the school (Dinkes et al., 2009; Gut & McLaughlin, 2012; Polirstok & Gottlieb, 2006).
Data Screening
The three outcome variables were screened for outliers that could skew the results of subsequent analyses. Scores on the three variables were standardized and cases were identified whose z-scores exceeded ±3.0. Cases were not deleted in their entirety because of extreme scores on one or two outcomes. Rather, only the extreme outcomes were deleted and other data were retained. On the attendance outcome variable, 323 cases were deleted, leaving 12,104 (97.40%) for further analysis. On the incident count outcome variable, 282 cases were deleted, leaving 12,145 (97.74%) for further analysis. On the credits earned outcome variable 100 cases were deleted, leaving 11,337 (99.13%) for further analysis.
Extreme scores (i.e., outliers) were deleted because they are for students with exceptionally unusual outcomes or may be errors in the data. Retaining these records can distort statistics calculated from the data (e.g., means, variances, correlations). A normal distribution is assumed in most statistical analyses, including analysis of variance (ANOVA) and multiple regression, as skewed data distort the statistics and introduce noise into the interpretation of the results (Meyers et al., 2013). Descriptive statistics for the three outcome variables (following removal of outliers) are provided in Table 2.
Table 2
Descriptive Statistics for Outcome Variables
|
Outcome Variable |
N |
Min |
Max |
M |
SD |
Skewness |
Kurtosis |
|
Attendance Percentage |
12,104 |
24.32 |
100.00 |
85.37 |
16.42 |
−1.667 |
2.257 |
|
Incident Count |
12,145 |
0.00 |
12.00 |
0.93 |
1.98 |
2.902 |
9.047 |
|
Credits Earned |
11,337 |
0.00 |
7.06 |
2.69 |
1.34 |
0.344 |
0.251 |
Screening for Multivariate Outliers
Outcome data were previously screened for univariate outliers, but cases can display typical scores on each of several individual variables and yet still be multivariate outliers (i.e., their pattern of scores on the collection of variables marks them as unusual). To screen for multivariate outliers, Mahalanobis distances were calculated for each case using the three outcome variables in the study—attendance, incidents, and credits earned. These Mahalanobis distances were then evaluated using the chi-square distribution with degrees of freedom equal to the number of variables used in calculating those distances (3) and α = .001 (Meyers et al., 2013). The critical value of χ2 = 16.266 was met or exceeded by 45 cases and all outcome data for these cases were eliminated from further analyses. With the elimination of these multivariate outliers, 12,059 scores on attendance (97.04% of the students for whom attendance data was reported), 12,100 scores on incidents (97.37%), and 11,292 scores on credits earned (98.73%) remained for further analysis. Descriptive statistics for the transformed and screened outcome variables are shown in Table 3.
Table 3
Descriptive Statistics for Outcome Variables Following Data Transformation and Screening
|
Outcome Variable |
N |
Min |
Max |
M |
Mdn |
SD |
Skewness |
Kurtosis |
|
|
Valid |
Missing |
||||||||
|
Log10attendance Percentage |
12,059 |
368 |
0.00 |
1.88 |
0.96 |
0.95 |
0.47 |
−0.10 |
−0.72 |
|
Recip-Incident Count |
12,100 |
327 |
0.08 |
1.00 |
0.79 |
1.00 |
0.31 |
−1.01 |
−0.69 |
|
Credits Earned |
11,292 |
1135 |
0.00 |
7.06 |
2.69 |
3.00 |
1.33 |
−0.39 |
0.25 |
Statistical Analysis
The research questions were addressed with a series of three standard multiple regression analyses using student climate ratings and outcome data aggregated to the school level. Schools served as cases in the analyses. It was hypothesized that academic and behavior outcomes are related to ratings of climate, regardless of school type: Schools with higher-rated climates will show greater attendance, fewer incidents, and more credits earned in 2012–2013. Three analyses (one using attendance as the dependent variable, a second using incidents as the dependent variable, and a third using credits as the dependent variable) were performed using student overall climate data, school type (dummy variable coded), and the appropriate student climate by school type product variables to assess the moderating effect of school type. The tests within each multiple regression analysis—two main effects and the interaction effect—are statistically independent, and so required no adjustment to control for Type I error rate (just as the each of the main effects and interaction effect in a factorial ANOVA are independent and can all be tested at the p = .05 level of significance).
Tests of the significance of the interaction term beta weights were used to determine if type of school moderates the relationship between climate and academic outcomes. In analyses that showed significant interaction terms, the nature of the interaction was evaluated by looking at the simple slopes. In analyses that showed no significant interaction effects, the interaction terms were dropped from the analysis and the regression analysis was performed again to evaluate the main effects of climate and school type on student outcome.
The three analyses differed in that each used a different student outcome variable. The first analysis examined attendance (represented by log10attendance); the second analysis examined discipline referral incidents (represented by recip-incidents); the third analysis examined credits (in raw score form). The results of each analysis are discussed in the next section.
Attendance
Listwise deletion of missing data left 45 schools available for the first analysis, which examined attendance as the dependent variable and independent variables student overall climate ratings, school type (dummy variable coded), and the climate by school type product variables needed to assess the interaction effect. The climate variable in each of these product variables was centered; that is to say, the mean on student overall climate was subtracted from each student climate score as recommended by Aiken and West (1991).
No interaction effect was hypothesized and none of the t-tests for the significance of the interaction term beta weights approached significance. Consequently, as recommended by Allison (1999), the analysis was repeated without the interaction terms in order to focus on the main effects of student climate ratings and type of school. Student climate ratings and type of school predicted 42.5% of the variance in log10attendance, F(4, 40) = 7.394, p < .001. The model is summarized in Table 4.
In predicting attendance, students’ ratings of overall school climate added significant unique explained variance beyond that explained by type of school, β = −0.325, t = −2.608, p = .013. As the log10attendance is an inverse measure of attendance, the negative beta weight indicates that, as ratings of climate improved, attendance also improved. In other words, students who provided higher school climate ratings also had better attendance. Given that student climate ratings added significantly to the prediction of attendance in this model, one would expect to find climate significantly correlated with attendance, but that was not the case. The correlation between student climate ratings and log10attendance was nonsignificant, r(43) = −.183, p = .114. This pattern of a significant beta weight associated with student climate ratings combined with a nonsignificant correlation between student climate ratings and log10attendance indicates that climate acted as a suppressor variable in the model. Meyers et al. (2013) explain that suppressor variables work by “…correlating with what is usually thought of as a source of error in another predictor. [In this way] the suppressor variable helps purify that predictor and thereby enhances its predictive power” (p. 182).
Table 4
Regression Coefficients and Tests of the Predictors in the Multiple Regression of Log10attendance on Student Climate Ratings and School Type
|
School Type |
Unstandardized Coefficients |
Standardized Coefficients |
p |
||
|
B |
SE |
β |
t |
||
|
Constant |
2.165 |
0.454 |
4.767 |
.000 |
|
|
Overall Climate Rating |
−0.406 |
0.156 |
−0.325 |
−2.608 |
.130 |
|
Innovative |
−0.027 |
0.156 |
−0.052 |
−0.308 |
.760 |
|
Behavior-Focused |
0.510 |
0.142 |
0.482 |
3.531 |
.001 |
|
Academic Remediation-Focused |
0.261 |
0.095 |
0.466 |
2.744 |
.009 |
School type was also a significant predictor of attendance. Each unstandardized regression weight in Table 4 reflects the difference between the mean attendance of the corresponding school type and the mean of the reference group (traditional schools), and the t-tests of the beta weights in Table 4 test the significance of those group differences. One or more significant beta weights associated with the school type dummy variable indicates a significant between-group difference and signals the presence of a main effect of type of school. However, the interpretation of these t-tests is complicated by the fact that each tests the difference between a school type group and the reference group while controlling statistically for the influence of climate on the dependent variable. Additionally, not all pairwise group differences that might be of interest are tested. Given these complexities, the simplest and most complete picture of the relationship between school type and attendance is provided by shifting the focus to a comparison of school type group means on the attendance variable using a one-way ANOVA.
Table 5 provides descriptive statistics for both raw score attendance and log-transformed attendance for each of the four school types. A one-way ANOVA was used to compare the school type means on attendance. Data from 47 schools were available for the analysis. The analysis found a significant effect of school type on attendance, F(3, 43) = 8.019, p < .001. Two differences were significant using the adjusted .017 level of significance: traditional vs. behavior-focused and innovative vs. behavior-focused. Both traditional and innovative schools had significantly higher rates of attendance than behavior-focused schools. Table 6 shows post-hoc comparisons of school types on attendance.
Table 5
Raw Score and Log-Transformed Attendance as Function of School Type
|
School Type |
Raw Attendance |
Log10attendance |
||||
|
n |
M |
SD |
n |
M |
SD |
|
|
Traditional |
8 |
83.90 |
6.03 |
8 |
0.99 |
0.19 |
|
Innovative |
20 |
85.82 |
6.96 |
20 |
0.96 |
0.24 |
|
Behavior-Focused |
4 |
62.08 |
3.48 |
4 |
1.48 |
0.06 |
|
Academic Remediation-Focused |
15 |
76.30 |
8.41 |
15 |
1.19 |
0.23 |
Table 6
Post-Hoc Comparisons of School Types on Attendance
|
School Type Comparison |
Mean Difference |
p |
|
Traditional vs. Innovative |
−1.92 |
.999 |
|
Traditional vs. Behavior-Focused |
21.82 |
.005 |
|
Traditional vs. Academic Remediation-Focused |
7.60 |
.336 |
|
Innovative vs. Behavior-Focused |
23.74 |
.001 |
|
Innovative vs. Academic Remediation-Focused |
9.52 |
.024 |
|
Behavior-Focused vs. Academic Remediation-Focused |
−14.22 |
.130 |
Note. The table shows differences in raw scores, but log-transformed scores were used in performing the pairwise post-hoc comparisons. All p values in this table are Bonferroni adjusted and two-tailed.
Incidents
Listwise deletion of missing data left 45 schools available for the second analysis, which examined number of discipline referral incidents (represented as recip-incidents) as the dependent variable and independent variables student overall climate ratings, school type (dummy variable coded), and the climate by school type product variables needed to assess the interaction effect. The climate variable in each of these product variables was centered (i.e., the mean student overall climate was subtracted from each student climate score).
A statistically significant 61.7% of the variance in recip-incidents was explained by the main and interaction effects, F(7, 37) = 8.526, p < .001. The model is summarized in Table 7. It can be seen there that the beta weight associated with one of the interaction terms was significant, (β = 6.722, t = 3.527, p < .001) indicating the presence of a significant climate by school type interaction effect (i.e., school type moderated the relationship between student climate and incidents). In other words, the relationship between school climate and incidents is not the same across all school types.
Table 7
Regression Coefficients and Tests of the Predictors in the Multiple Regression of Incidents Reported on Student Climate Ratings and School Type
|
School Type |
Unstandardized Coefficients |
Standardized Coefficients |
p |
||
|
B |
SE |
β |
t |
||
|
Constant |
0.464 |
0.458 |
1.014 |
.317 |
|
|
Overall Climate Rating |
0.121 |
0.158 |
0.155 |
0.763 |
.450 |
|
Innovative |
−0.840 |
0.588 |
−2.576 |
−1.430 |
.161 |
|
Behavior-Focused |
−0.036 |
2.359 |
−0.055 |
−0.015 |
.988 |
|
Academic Remediation-Focused |
−2.427 |
0.651 |
−6.931 |
−3.728 |
.001 |
|
Overall Climate by Innovative |
0.286 |
0.203 |
2.565 |
1.414 |
.166 |
|
Overall Climate by Behavior-Focused |
−0.074 |
0.797 |
−0.339 |
−0.093 |
.926 |
|
Overall Climate by Academic Remediation-Focused |
0.776 |
0.220 |
6.722 |
3.527 |
.001 |
The R2 contribution of the climate by school type interaction effect in this analysis was 13.67% and the presence of the interaction effect means that the strength of the relationship between climate and recip-incidents differed significantly from one school type to the next. In other words, the strength of the relationship between climate and incidents earned differed significantly from one school type to the next. Figure 1 captures the nature of this interaction effect by graphing the simple slopes (i.e., the regression lines of recip-incidents on climate under each level of type of school). Figure 1 shows that climate was more strongly associated with recip-incidents in innovative and academic remediation-focused schools than in traditional and behavior-focused schools. All schools showed a general pattern of better climate ratings associated with fewer incidents. Innovative and academic remediation schools showed the sharpest decrease in incidents as school climate ratings increased. Table 8 provides additional information about each of the simple slopes, including Pearson correlations between climate and recip-incidents, regression constants, regression weights, and t-tests for the significance of the regression weights. It should be noted that positive slopes, positive correlations, and positively signed regression weights all indicate negative relationships between climate and reported incidents because recip-incidents is inversely related to the raw score incidents variable.
Table 8
Tests of the Significance of the Simple Slopes for the Regression of Recip-Incidents on School Climate for Each of the Four School Types
|
School Type |
Simple Slopes |
||||||
|
n |
r |
Constant |
b |
t |
df |
p |
|
|
Traditional |
8 |
.423 |
0.82 |
0.12 |
0.76 |
37 |
.450 |
|
Innovative |
20 |
.584 |
0.82 |
0.41 |
3.23 |
37 |
.003 |
|
Behavior-Focused |
4 |
.058 |
0.57 |
0.05 |
0.06 |
37 |
.480 |
|
Academic Remediation-Focused |
15 |
.851 |
0.68 |
0.90 |
5.88 |
37 |
<.001 |
Note. All p values in this table are two-tailed.
Figure 1
Simple Slopes for The Regression of Recip-Incidents on Student Climate Ratings for Each of the Four School Types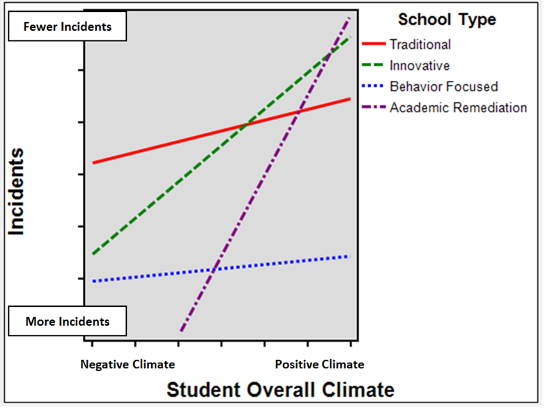
The climate by school type interaction effect precludes making sweeping statements about the influence of climate on incidents, as this effect was moderated by type of school.
Credits
Listwise deletion of missing data left 44 schools available for the third analysis, which examined credits earned in one semester as the dependent variable and independent variables student overall climate ratings, school type (dummy variable coded), and the climate by school type product variables needed to assess the interaction effect. The climate variable in each of these product variables was centered (i.e., the mean student overall climate was subtracted from each student overall climate score). A statistically significant 44.6% of the variance in credits earned was explained by the main and interaction effects, F(7, 36) = 4.141, p = .002. The model is summarized in Table 9. As seen in that table, the beta weight associated with one of the interaction terms in the model was significant, (β = 11.562, t = 2.611, p = .013), indicating that the climate by school type interaction effect contributed a significant portion of the explained variance in credits earned.
Table 9
Regression Coefficients and Tests of the Predictors in the Multiple Regression of Credits Earned on Student Climate Ratings and School Type
|
School Type |
Unstandardized Coefficients |
Standardized Coefficients |
p |
||
|
B |
SE |
β |
t |
||
|
Constant |
0.526 |
2.668 |
0.197 |
.845 |
|
|
Overall Climate Rating |
0.736 |
0.923 |
0.195 |
0.797 |
.431 |
|
Innovative |
−2.313 |
3.485 |
−1.463 |
−0.664 |
.511 |
|
Behavior-Focused |
−37.172 |
13.744 |
−11.966 |
−2.705 |
.010 |
|
Academic Remediation-Focused |
−4.496 |
3.792 |
−2.674 |
−1.186 |
.244 |
|
Overall Climate by Innovative |
0.807 |
1.204 |
1.483 |
0.670 |
.507 |
|
Overall Climate by Behavior-Focused |
12.115 |
4.641 |
11.562 |
2.611 |
.013 |
|
Overall Climate by Academic Remediation-Focused |
1.351 |
1.282 |
2.438 |
1.054 |
.299 |
The R2 contribution of the climate by school type interaction effect was 11.2% and the presence of the interaction effect means that school type moderated the relationship between student climate ratings and credits earned. In other words, the strength of the relationship between climate and credits earned differed significantly from one school type to the next. Figure 2 captures the nature of this interaction effect by graphing the simple slopes (i.e., the regression lines of credits earned on climate under each level of type of school). It can be seen in Figure 2 that climate was most strongly associated with credits earned in behavior-focused schools and least associated with credits earned in traditional schools. Table 10 provides additional information about each of the simple slopes, including Pearson correlations between student climate ratings and credits earned, regression constants, regression weights, and t-tests for the significance of the regression weights.
Table 10
Tests of the Significance of the Simple Slopes for the Regression of Credits Earned on School Climate for Each of the Four School Types
|
School Type |
Simple Slopes |
||||||
|
n |
r |
Constant |
b |
t |
df |
p |
|
|
Traditional |
8 |
.488 |
2.69 |
0.74 |
0.80 |
36 |
.431 |
|
Innovative |
19 |
.427 |
2.75 |
1.54 |
2.00 |
36 |
.053 |
|
Behavior-Focused |
3 |
.997 |
1.11 |
12.85 |
2.83 |
36 |
.008 |
|
Academic Remediation-Focused |
14 |
.505 |
2.16 |
2.09 |
2.35 |
36 |
.025 |
Note. All p values in this table are two-tailed.
The climate by school type interaction effect precludes sweeping statements about the influence of climate on credits earned, as this effect was moderated by type of school.
Figure 2
Simple Slopes for the Regression of Credits Earned on Student Climate Ratings for Each of the Four School Types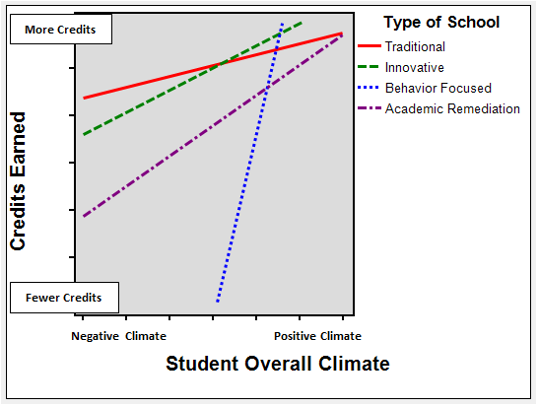
Results and Discussion
School climate experienced a resurgence in the literature during the last two decades as an essential component of school reform policy, in part because of increased national focus on educational accountability (Cohen et al., 2009; Sanders et al., 2018). The importance of school climate on student achievement was noted by Hoy and Hoy (2006) who asserted that school outcomes are best examined when considering the climates from which they came.
School climate is a critical factor in the achievements of students, especially for those who struggle most academically and behaviorally as well as for students with disabilities. For example, a series of studies that investigated characteristics of good high schools for students with disabilities (Brigham et al., 2006) established common climate characteristics, including perceptions of high academic press, safety, and inclusive environments. A recent study by Sanders et al. (2018) found that the relation of school climate ratings and academic achievement is stronger for students with disabilities than for their peers without disabilities. These results suggest that perceptions of school climate may be particularly important for students most at risk of school failure. Further, as noted, students with disabilities or are otherwise at risk are most likely to be overrepresented in specific alternative school settings, such as behavior-focused and academic remediation-focused schools. (Perzigian et al., 2017; Wilkerson et al., 2016). This study adds to the literature by disaggregating and examining relationships between student perceptions of school climate and three student outcome variables in different school types. Most school climate and student outcome research does not specifically address type of school, yet it is necessary for the field to understand the unique context of alternative education and the climate impetus for achievement.
We hypothesized that each outcome is related to student ratings of climate, regardless of school type: Schools with higher-rated climates will show greater student attendance, fewer student discipline referral incidents, and more credits earned. The hypothesis was rejected, as climate ratings did not universally predict student outcomes, as detailed below.
Student climate ratings did not predict attendance; they mathematically enhanced the predictive effectiveness of school type by serving as a suppressor variable. In other words, climate did not carry any predictive power of its own but did provide value in this model by enhancing the predictive effectiveness of school type. Ratings of school climate did covary with attendance, however: as ratings of climate improved, attendance also improved. Our analysis found significant differences in attendance by school type. Traditional and innovative schools showed approximately equal, high levels of attendance, behavior-focused schools showed the lowest levels of attendance, and the mean for academic remediation-focused schools fell between those two extremes. Two differences were significant: traditional vs. behavior-focused schools and innovative vs. behavior-focused schools.
Students’ climate ratings were predictive of discipline referral incidents in two school types: innovative and academic remediation-focused alternative schools. In both of these school types, better climate ratings were associated with fewer incidents. By contrast, in traditional schools the number of behavioral incidents was relatively uniform and low regardless of school climate ratings; in behavior-focused alternative schools, it was similarly uniform and high.
There is a notable trend in this finding, in that students’ perceptions of climate predicted frequency of behavior incidents in schools of choice (innovative and academic remediation-focused alternative schools), but not in schools that students attend by default or referral (traditional or behavior-focused alternative schools). This suggests that the environment in which students learn may be especially critical when they elect to attend a particular school, rather than defaulting or referral into the setting. In contrast, the outcomes of students attending zoned or remedial schools seem to be less influenced by school climate.
It is logical that students would be more academically engaged in settings in which they feel comfortable. Prior research has documented this phenomenon (e.g., Cohen et al., 2009; Cotton, 1996). It is interesting, however, that student climate ratings were unrelated to incidents in traditional and behavior-focused alternative schools. What might be the climate characteristics in behavior-focused settings that negate the positive benefits of feeling good toward school? Conversely, what characteristics of traditional schools might protect against negative behavioral impacts of viewing school poorly?
Type of school also moderated the relationship between ratings of climate and credits earned: School climate was most strongly associated with credits in behavior-focused and academic remediation-focused alternative schools and least associated with credits earned in traditional schools. This trend suggests that school climate is particularly important for the academic success of students who are most at risk for academic failure: those who have been referred out of traditional settings due to behavioral challenges and students who have fallen behind their peers in accruing credits toward graduation. By contrast, the majority of students in innovative and traditional schools appear to earn high numbers of credits with only a small range of variation due to school climate. These results indicate that behavior-focused and academic remediation-focused alternative schools have the potential to be academically transformative for the most at-risk students, provided that a positive school climate exists within them.
It is worth noting that, in type of school analyses, students in behavior-focused alternative schools earned fewer credits than students in other types of schools, including significantly fewer than students in traditional and innovative alternative schools. It is disappointing that students who may need the most intensive supports fall short in credits earned in comparison to their peers in other settings. Previous research has widely documented the relationships between negatively perceived school climate, difficult behavior, and poor academic performance (e.g., Cohen et al., 2009; Lane et al., 2008; Nelson et al., 2004). Thus, it is important for students who attend remedial alternative schools to have access to even more positive climates and increased academic support, rather than static or potentially decreased support or climates similar to the ones from which they have been removed.
Overall, the analysis of data in this study suggests that student perceptions of school climate does not uniformly predict specific outcome measures. Rather, school type plays an integral role in the effect of school climate on these outcomes. Though beyond the scope of this study, subsequent examination of school-level factors in different school types that impact both climate and student outcome is necessary.
Limitations and Recommendations for Further Research
This study is an important first step toward understanding the ways in which school climate may predict student outcome in different school types. This is the first study to specifically analyze school climate in one urban district across traditional and alternative school settings, and the finding that school climate does not uniformly predict student achievement is notable. However, there are several issues related to school climate and alternative education that merit further research. A small number of behavior-focused alternative schools was represented in the survey data; further research is needed in a district that can provide more data from behavior-focused alternative schools. A larger sample would provide the improved statistical power needed to better understand the predictive climate characteristics of this important school category. Future research should examine the relationship between student outcomes and the perceptions of climate as rated by parents affiliated with the school and staff working within them. These other stakeholder perspectives may inform policy and student movement between school placements.
While data availability was limited, additional research in this area could yield interesting and important findings if climate data from multiple years were analyzed in conjunction with student outcome data. A longitudinal study of climate and outcomes could reveal interesting patterns. For example, is there evidence that climate improvements are followed by outcome improvements? How long is the lag? How quickly do students respond to a changed climate when they are moved from one school to another? Do students enrolled in settings with consistently highly rated climates have better outcomes regardless of school type? Findings related to duration of enrollment in schools with varying types of climates may provide further information regarding students’ experiences than the findings of this study, which utilizes data from a single time point.
Choice in the selection of a sample school district was limited. In order to obtain the data needed to support the analyses planned for this study, the selected district needed to provide both school climate data and also student outcome data, and not all school districts collect data this extensive. An additional limitation is the low number of behavior-focused alternative schools represented in the study. The sample district operates eight behavior-focused alternative schools, but missing data and loss of data to statistical cleaning resulted in three behavior-focused alternative schools being included in the analysis. This number certainly limited results of the analysis due to low statistical power; including a larger sample of behavior-focused alternative schools in the analysis would strengthen both the statistical power and external validity of the study. Finally, though it was beyond the scope of this study to analyze whether climate predicts behavior or behavior is the catalyst for climate in alternative schools, it would be a welcome addition to this line of scholarship.
References:
Aiken, L. S., & West, S. G. (1991). Multiple regression: Testing and interpreting interactions. Sage.
Allison, P. D. (1999). Multiple regression: A primer. Pine Forge Press.
Anderson, C. (1982). The search for school climate: A review of the research. Review of Educational Research, 52, 368–420.
Bradshaw, C., Koth, C., Thornton, L., & Leaf, P. (2009). Altering school climate through school-wide positive behavioral interventions and supports: Findings from a group-randomized effectiveness trial. Prevention Science, 10, 100–115.
Brigham, N., Parker, C. E., Morocco, C. C., & Zigmond, N. (2006). Apalachee high school: The last real high school in America. “You don’t go to Apalachee, you belong to it.” Learning Disabilities Research & Practice, 21, 172–183.
Centers for Disease Control and Prevention (2009). School connectedness: Strategies for increasing protective factors among youth. U.S. Department of Health and Human Services. http://www.cdc.gov/healthyyouth/protective/pdf/connectedness.pdf
Cohen, J. & Geier, V. K. (2010, January). School Climate Research Summary [Research Brief]. Center for Social and Emotional Education. https://www.cde.state.co.us/sites/default/files/documents/pbis/bullying/downloads/pdf/scbrief_ver1no1_jan2010.pdf
Cohen, J., McCabe, E. M., Michelli, N. M., & Pickeral, T. (2009). School climate: Research, policy, practice, and teacher education. Teachers College Record, 111, 180–213.
Cotton, K. (1996). School size, school climate, and student performance. School Improvement Research Series (Close-up #20). Retrieved from https://educationnorthwest.org/sites/default/files/SizeClimateandPerformance.pdf
Davis, J. R., & Warner, N. (2018). Schools matter: The positive relationship between New York City high schools’ student academic progress and school climate. Urban Education, 53, 959–980.
Dinkes, R., Kemp, J., Baum, K., & Snyder, T. D. (2009). National Center for Education Statistics: Indicators of school crime and safety: 2007. http://nces.ed.gov
Durkheim, E. (1961). Moral education: A study in the theory and application of the sociology of education. Free Press.
Edmonds, R. (1979). Effective schools for urban poor. Educational Leadership, 37, 15–24.
Fatou, N., & Kubiszewski, V. (2018). Are perceived school climate dimensions predictive of students’ engagement? Social Psychology of Education, 21, 427–446.
Felner, R. D., Brand, S., DuBois, D. L., Adan, A., Mulhall, P. F., & Evans, E. G. (1995). Socioeconomic disadvantage, proximal environmental experiences, and socioemotional and academic adjustment in early adolescence: Investigation of a mediated effects model. Child Development, 66, 774–792.
Freiberg, H. J. (Ed.). (1999). School climate: Measuring, improving and sustaining healthy learning environments. Falmer Press.
Gregory, A., Cornell, D., Fan, X., Sheras, P., Shih, T., & Huang, F. (2010). Authoritative school discipline: High school practices associated with lower student bullying and victimization. Journal of Educational Psychology, 102, 483–496.
Gut, E., & McLaughlin, J. M. (2012). Alternative education’s impact on office disciplinary referrals. A Journal of Educational Strategies, Issues, and Ideas, 85, 231–236.
Haynes, N. M., Emmons, C., & Ben-Avie, M. (1997). School climate as a factor in student adjustment and achievement. Journal of Educational and Psychological Consultation, 8, 321–329.
Hoy, A. W., & Hoy, W. K. (2006). Instructional leadership: A research-based guide to learning in schools. Allyn and Bacon.
Hoy, W. K., Tarter, C. J., & Kottkamp, R. B. (1991). Open schools/healthy schools: Measuring organizational climate. Sage.
Hoyle, J. R., English, F., & Steffy, B. E. (1985). Skills for successful leaders. Arlington, VA: American Association of School Administrators.
Konishi, C., Miyazaki, Y., Hymel, S., & Waterhouse, T. (2017). Investigating associations between school climate and bullying in secondary schools: Multilevel contextual effects modeling. School Psychology International, 38, 240–263.
Lane, K. L., Barton-Arwood, S. M., Nelson, J. R., & Wehby, J. (2008). Academic performance of students with emotional and behavioral disorders served in a self-contained setting. Journal of Behavioral Education, 17, 43–67.
Lee, T., Cornell, D., Gregory, A., & Fan, X. (2011). High suspension schools and dropout rates for Black and White students. Education and Treatment of Children, 34, 167–192.
Lehr, C. A., & Lange, C. M. (2003). Alternative schools serving students with and without disabilities: What are the current issues and challenges? Preventing School Failure, 47, 59–65.
Lindstrom-Johnson, S., Waasdorp, T.E., Cash, A.H., Debnam, K.J., Milam, A.J., & Bradshaw, C. (2017). Assessing the association between observed school disorganization and school violence: Implications for school climate interventions. Psychology of Violence, 7, 181–191.
Luiselli, J. K., Putnam, R. F., Handler, M. W., & Feinberg, A. B. (2005). Whole-school positive behavior support: Effects on student discipline problems and academic performance. Educational Psychology, 25, 183–198.
Maxwell, S., Reynolds, K. J., Lee, E., Subasic, E., & Bromhead, D. (2017). The impact of school climate and School Identification on academic achievement: Multilevel modeling with student and teacher data. Frontiers in Psychology, 8, 2069–2089.
Meyers, L. S., Gamst, G., & Guarino, A. J. (2013). Applied multivariate research: Design and Interpretation. Sage.
National School Climate Council (2007). The school climate challenge: Narrowing the gap between school climate research and school climate policy, practice guidelines and teacher education policy [White Paper]. https://schoolclimate.org/wp-content/uploads/2021/05/school-climate-challenge-web.pdf
Nelson, J. R., Benner, G. J., Lane, K., & Smith, B. W. (2004). An investigation of the academic achievement of K–12 students with emotional and behavioral disorders in public school settings. Exceptional Children, 71, 59–73.
Netzel, D. M., & Eber, L. (2003). Shifting from reactive to proactive discipline in an urban school district: A change in focus through PBIS implementation. Journal of Positive Behavior Interventions, 5, 71–79.
Perry, A. (1908). The management of a city school. Macmillan.
Perzigian, A. B., Afacan, K., Justin, W., & Wilkerson, K. L. (2017). Characteristics of students in traditional versus alternative high schools: A cross sectional analysis of enrollment in one urban district. Education and Urban Society, 49, 676–700.
Perzigian, A. B. & Braun, M. (2020). A comparison of school climate ratings in urban alternative and traditional high schools. Journal of Educational Research and Practice, 10, 351–365.
Perzigian, A. B. & Braun, M. (2021). Differences in perceptions of school climate by student race in an urban school district. Journal of Education and Social Justice, 1, 60–73.
Polirstok, S., & Gottlieb, J. (2006). The impact of positive behavior intervention training for teachers on referral rates for misbehavior, special education evaluations and student reading achievement in elementary grades. International Journal of Behavioral Consultation and Therapy, 2, 354–361.
Raywid, M. A. (1994). Alternative schools: The state of the art. Educational Leadership, 52, 26–31.
Sanders, S. M., Durbin, J. M., Anderson, B. G., Fogarty, L. M., Giraldo-Garcia, R.J., & Voight, A. (2018). Does a rising school climate lift all boats? Differential associations of perceived climate and achievement for students with disabilities and limited English proficiency. School Psychology International, 39, 646–662.
Sebring, P. B., Allensworth, E., Bryk, A. S., Easton, J. Q., & Luppescu, S. (2006). The essential supports for school improvement. Consortium on Chicago School Research at the University of Chicago.
Somers, C. L., & Gizzi, T. J. (2001). Predicting adolescents’ risk behaviors: The influence of future orientation, school involvement, and school attachment. Adolescent & Family Health, 2(1), 3–11.
Sterbinsky, A., Ross, S., & Redfield, D. (2006). Effects of comprehensive school reform on student achievement and school change: A longitudinal multi-site study. School Effectiveness & School Improvement, 17, 367–397.
Stewart, E. B. (2008). School structural characteristics, student effort, peer associations, and parental involvement: The influence of school- and individual-level factors on academic achievement. Education and Urban Society, 40, 179–204.
Sugai, G., & Horner, R. (2002). The evolution of discipline practices: School-wide positive behavior supports. Child and Family Behavior Therapy, 24, 23–50.
Thapa, A., Cohen, J., Guffey, S., & Higgins-D’Alessandro, A. (2013). A review of school climate research. Review of Educational Research, 83, 357–385.
Warner, R. M. (2008). Applied statistics: From bivariate through multivariate techniques. Sage.
Wilkerson, K. L., Afacan, K., Perzigian, A. B., Justin, W., & Lequia, J. (2016). Behavior-focused alternative schools: Impact on student outcomes. Behavioral Disorders, 41(2), 81–94.
Wisner, B. L. (2014). An exploratory study of mindfulness meditation for alternative school students: Perceived benefits for improving school climate and student functioning. Mindfulness, 5, 626–638.
Yang, C., Sharkey, J. D., Reed, L. A., Chen, C., & Dowdy, E. (2018). Bullying victimization and student engagement in elementary, middle, and high schools: Moderating role of school climate. School Psychology Quarterly, 33, 54–64.