


Inclusion Census: How Do Inclusion Rates in American Public Schools Measure Up?
Abstract:
This study examines trends and variations of inclusion placement for students with disabilities (SWDs) in the United States using Florida as a state-level case study. The study investigates three main areas: placement trends in inclusion settings that exist based on disability category and race, inclusion rates in the largest counties in the state compared to the mean of inclusion in the state, and inclusion variations across all public school levels in the fourth largest, urban school district in the US. Findings suggest that although the rate of inclusion is increasing, there is a lack of equity in inclusion placement practices.
Keywords: special education, inclusion, students with disabilities, educational placement
Educational researchers have long discussed the education of students with disabilities (SWDs) in inclusive settings and related equity gaps (Artiles et al., 2006; Cole et al., 2021; McLeskey et al., 2012; Pak & Parsons, 2020; Williamson et al., 2020). The Individuals with Disabilities Education Act (IDEA) requirements have created pressure to address historical inequities in educational outcomes, achievement, and opportunities for SWDs. For example, the 2004 reauthorization of IDEA and the Every Student Succeeds Act (ESSA) of 2015 further amplify the right for SWDs to receive a free and appropriate public education (FAPE) in the least restrictive environment (LRE). Disability rights advocates argue that the LRE is always the general education setting, as the law calls for SWDs to receive special education services alongside their nondisabled peers to the most extent possible (Choi et al., 2020; Kirby, 2017). These policy reforms in special education have driven school districts to provide special education services in more inclusive settings (Author, 2014; Goodman et al., 2011; van Seen & Wilson, 2020).
However, racially, ethnically, and linguistically diverse (RELD) students in urban areas are disproportionately referred, identified, and placed in special education and are more frequently segregated and excluded from general education once placed (Blanchett et al., 2009). While inclusion percentages have increased, questions remain about the equity of inclusion placements and practices for RELD SWDs (Giangreco, 2020). Blanchett et al. (2009) argue that the issues of disproportionality in the identification and placement of SWDs at the intersection of race, culture, language, and disability and the continued segregation of these students are perpetuating educational inequities while simultaneously perpetuating White dominance. Skrtic et al. (2021) note that the role of race in disability classification has shaped disability labeling for RELD students, ultimately leading to more students from minoritized backgrounds being represented in “low-status” disability categories that are less frequently considered for inclusion.
In this article, we draw attention to factors affecting inclusion placement and discuss equity issues in urban schools that impact the placement of RELD SWDs in inclusive settings. We then use a state-level case study in Florida using descriptive statistics t-tests, General Linear Modeling (GLM), and multilevel analyses to draw attention to the inequities in inclusion placement in US public schools. We illustrate placement trends in inclusion settings that exist based on disability category and race, inclusion rates in the top 20 populated counties of a large southeastern state compared to the mean of inclusion in the state, and inclusion variations across all school levels in the fourth largest school district in the country. Although inclusion rates are increasing overall, inequities persist in inclusive practices. In our discussion, we present suggestions for future research to shift placement practices for RELD SWDs.
Background on Special Education Settings
The term “inclusion” refers to SWDs in a general education classroom for 80% or more of the school day and therefore is considered the starting point of the LRE (Grindal et al., 2019; McLeskey et al., 2012; National Council on Disability [NCD], 2018; Williamson et al., 2020). Modern-day inclusion models have branched out from the more traditional co-teaching frameworks and now include support facilitation and consultation services (Broward County Public Schools [BCPS], 2017; Friend, 2015), which may lead to the successful outcomes of SWD. Efficacious inclusion programs constitute an integrative setting where SWDs receive the same curriculum and standards-based instruction alongside students without disabilities in a general education classroom for 80% or more of the school day with support services and accommodations given by a highly-qualified special education teacher (Choi et al., 2020; Gilmour, 2018; McLeskey et al., 2012).
The reform in federal legislation and mandates have been the impetus behind states and school districts pressing for the placement of more SWDs in inclusion settings (Cole et al., 2021; Giangreco, 2020; Kirby, 2017; Williamson et al., 2020) to meet compliance requirements (Voulgarides, 2022). Giangreco (2020) confirms that in the United States, the percentage of SWDs placement in inclusion settings has increased over the past 30 years; however, Giangreco questions the equity of the placement trends. In 2019, the US Department of Education (USDOE, 2022) reported that SWDs across the country, ages 5–21, who received special education services in inclusive classrooms was 64.8%, a substantial increase from 19 years prior, in 2000, when the percentage was 46.5% (Cole et al., 2021; National Center for Education Statistics [NCES], 2019). In 2019, the percentage of SWDs serviced within an inclusive setting (ages 6–21) in Florida was 77% (Florida Department of Education [FLDOE], 2020), which was higher than the national percentage. Yet, disproportionality remains for inclusion placement among disability categories, race, and school levels.
Factors Affecting Inclusion Placement
The federal mandates that have been the catalyst for restructuring the decision-making in placement and service delivery for SWDs in LRE are not without flaws (Cole et al., 2021). Voulgarides (2022) argues that the compliance-based approach used to implement federal mandates has failed to meet the needs of SWDs. Various factors can affect inclusion placement, including historical systemic biases, proper interpretation of LRE, and teacher factors.
Historical Systemic Biases
Systemic biases have long existed, perpetuating segregation for SWDs, particularly those from RELD groups. Students from minoritized groups are more likely to be identified as having a disability and to receive services in a “substantially separate setting” (Grindal et al., 2019, p. 542). This is due to systemic biases that are perpetuated in placement processes. For example, Skrtic et al. (2021) analyzed a large federal longitudinal dataset. They found that minoritized students are overrepresented in what he deems as “low status” disability categories (i.e., intellectual disabilities [ID] and emotional and behavioral disorders [EBD]). This is in line with what Sullivan and Artiles (2011) termed the racial stratification of disabilities. This bears significance on the inclusion conversation, as historically, students with EBD have been the least included, with low rates of inclusion for students with ID as well (NCES, 2022).
Conversely, White students tend to be overrepresented in “higher status” disabilities such as attention deficit hyperactivity disorder or specific learning disabilities (SLD), categories that are most often linked to inclusive placements (NCES, 2022). This racial stratification serves as a legal justification for segregation (Sullivan & Artiles, 2011). Grindal et al.’s recent study (2019) found that regardless of income level, racial disparities persist in special education identification and placement decisions. These disparities lead to increased segregation and decreased opportunities to access high-quality instruction.
Interpreting Least Restrictive Environment
Giangreco (2020) suggests that ableism, school districts misapplying the provisions of LRE, and teachers having difficulty utilizing inclusive practices account for why schools do not place SWDs in general education classrooms. Giangreco further clarified significant misinterpretations of how to determine LRE placement, such as (a) students’ disability categories do not dictate their educational placement, (b) SWDs are not required to be functioning at or close to grade-level expectations to be placed in an inclusive setting, and (c) SWDs do not need to change or conform to predetermined standards to be placed in inclusion. Decisions about educational placement for RELD SWDs are often based on these misinterpretations.
Teacher Factors
Another factor impacting the rate of inclusion placement is the surge in inclusive education (IE) for SWDs, which requires more diversification of teacher roles (van Steen & Wilson, 2020). IE was initially defined simply as placing SWDs in mainstream programs with their nondisabled peers (Artiles et al., 2006). Through the evolution of IE, there has been a shift to change the historical segregation of SWDs by transforming school culture, implementing equity-based practices, and enhancing the achievement of all students (Artiles et al., 2006; Choi et al., 2020). Depending on teachers’ knowledge of evidence-based practices and their willingness to apply creative problem-solving skills needed to support their students, teachers may serve to hinder or expand opportunities for success for SWDs (Giangreco, 2020). For IE to have the desired effect, teachers must be willing to acclimate their pedagogy and be capable of diversifying their lesson plans, making adaptations to their classroom settings, implementing accommodations, and managing disruptive behaviors (Dev & Haynes, 2015; van Steen & Wilson, 2020). Teachers, who are key members of the Individualized Education Program team, are at the forefront of IE and are the first level of support SWDs will receive; their attitudes toward this movement can serve as an advantage or a disadvantage for students.
Relatedly, Grindal et al. (2019) argue that a teacher’s interpersonal racism, or explicit and implicit beliefs regarding the capacity of students from diverse backgrounds (e.g., RELD, SWDs, low social class) impacts student educational placement. Biased teacher perceptions at the intersection of race and disability may result in reduced teacher advocacy for inclusion placement and further exclusion of students of color and/or SWDs (Fish, 2019). Studies examining teacher attitudes toward inclusion have shown mixed findings. Using a meta-analysis, van Steen and Wilson (2020) reviewed 64 studies from all over the world regarding teacher attitudes toward inclusion. Results revealed that, in general, teachers have a positive attitude toward including SWDs within general education classrooms and showed a willingness to support inclusion. van Mieghem et al. (2020) contradicted the results from the previous study in a systematic review and meta-analysis. In their review of 26 studies, van Mieghem et al. noted that teachers generally had negative attitudes toward IE and suggested that they felt unprepared to support SWDs aptly and needed more targeted and effective professional development.
Equity in Public Education
Schools do not place all SWDs in inclusive settings at the same rate. Fish (2019) contends that schools continue to sort SWDs in ways that perpetuate racial inequities. In a comprehensive study by Grindal et al. (2019), the authors analyzed data sets for three US states to investigate differences in placement for SWDs enrolled in K–12 schools. Their findings concluded that SWDs who are Black or Hispanic were more likely to be placed in segregated classroom settings compared to SWDs who are White (Grindal et al., 2019). Proponents of IE, Gatlin and Wilson (2016) believe the overrepresentation of minority groups in special education and their placement in more restrictive settings limits their opportunities for success instead of increasing them. Author (2014) reported a shift of students identified with SLD from primarily White students to students of color. Additionally, the authors stated that urban students with an SLD are less likely to be in inclusive settings than suburban SLD students. Overall, RELD students in special education are more likely to be serviced in separate settings (Author, 2014).
Another equity gap in urban education is the aforementioned disability hierarchy, the belief that some disability categories (i.e., higher-status disabilities) are preferred over others (i.e., lower-status disabilities). This stratified status is reaffirmed by Fish (2019), whose research revealed that White students are more likely to be identified with a higher-status disability. In contrast, students of color are more often identified with a lower-status disability. Gilmour (2018) suggests that students selected for inclusion may have higher academic abilities and fewer behavioral challenges than those placed in less inclusive settings. Goodman et al. (2011) found that schools place students with mild disabilities, those working toward a standard diploma, and those assessed using statewide assessments in inclusive settings more often. These discrepancies and variations in inclusion placement based on disability category and race motivated analyzing inclusion placement in public schools.
Equity gaps and disproportionality also exist among school levels. A study conducted by McLeskey et al. (2012) analyzed the cumulative placement rates for SWDs in 1990–1991 and 2007–2008 across the United States, taking into account the 13% increase in students identified with disabilities during this period. Their analysis looked at inclusion rates at the elementary (ages 6–11) and secondary (ages 12–17) levels. Results showed that placement of elementary level SWDs in inclusive general education settings increased by approximately 59% from 1990–1991 to 2007–2008, and placement of secondary level SWDs soared by 191% (McLeskey et al., 2012). More recently, Williamson et al. (2020) studied placement trends from 1990 to 2015 and reported that inclusion placement at the elementary level increased by 66% and 235% at the secondary level. Thus, the rate at which schools place students in an inclusion setting is rising at the elementary and secondary levels; however, the secondary level has increased significantly.
Additionally, in their examination of national trends in the educational placement of SWDs from 1990 to 2015, Williamson et al. (2020) acknowledged the rapid growth of inclusion placement at the secondary level but pointed out that students in secondary schools continued to be placed in resource pullout settings more often than elementary students. Their report also found that students with SLD, other health impaired (OHI), and autism spectrum disorders (ASD) accounted for the increase in general education placement. Coincidently, students with ID and EBD accounted for decreased pullout placements and an increase in inclusion placement (McLeskey et al., 2012; Williamson et al., 2020). Multiple studies have indicated that students with SLD have garnered the highest increase in inclusion placement in public schools across the United States among all the disability groups (McLeskey et al., 2012; NCD, 2018; Williamson et al., 2020).
Our literature review indicates that inclusion rates have increased; however, the rates vary by disability category, race, and school level. Students with ID or EBD, RELD students, and those in urban settings continue to be separated and segregated from the general student population. The research questions in this article aim to break down the inclusion rates in American public schools by exploring Florida public schools’ datasets with a closer focus on Miami-Dade County Public Schools (MDCPS). In 2010, the United States Census Bureau (2021) rated the city of Miami as the fourth most populous urbanized area, and MDCPS is the fourth largest urban school district in the country, with RELD students making up 93.5% of the total population of students (MDCPS, 2020). This study aimed to examine trends and variations of inclusion placement for SWDs in urban educational settings. Using a Florida data set, we applied an inverted pyramid approach to narrow our examination of inclusion placement by initially looking at the overall state’s placement trends based on disability and race, followed by the overall mean data for inclusion placement in the largest populated counties in the state. We concluded with an analysis of placement trends in all school settings within the largest urban county in the state. We investigated the following three questions: (1) What inclusion placement trends exist for SWDs at the intersection of disability category and race? (2) How does the percentage of SWDs serviced in inclusion settings in the largest counties compare to overall state percentages? (3) What inclusion placement trends exist for SWDs at the school level (e.g., elementary, middle, high) within a large urban district?
Methodology
Data Sources
The data for this study were secondary public data obtained electronically from the FLDOE website. In 2020, Florida reported servicing 2,858,949 students in grades PK–12, with 14% being SWDs (FLDOE). As per federal and state mandates, school districts must provide accurate information regarding SWDs yearly (Gilmour, 2018). Florida’s State Education Agency (SEA) creates a yearly profile that targets 16 indicators relating to the educational environment, educational benefit, prevalence, parental involvement, and federal requirements for planning improvements in special education programs (FLDOE, 2020). Likewise, each county’s Local Education Agency (LEA) creates a profile and submits it to the state. The state then furnishes this information to the USDOE to be included in the annual report to congress that relays information on the national progress in providing IDEA services (USDOE, 2020; Williamson et al., 2020). This public information includes, but is not limited to, state assessment scores, graduation rates, environmental placement, disability categories, race/ethnic background information, and teacher qualification information.
Among the data reported by the state are child counts for the educational environments of SWDs (ages 6–21) who were provided services in Florida schools. The data was reported under IDEA Part B during the 2019–20 school year (SY; n = 377,535) by eligibility category and race. We used these data for our initial research question, investigating overall inclusion placement trends for SWDs (ages 6–21) based on disability category and race. Concerning our second research question, the Florida SEA and LEA Profiles for the 20 largest counties were examined in the following years and correspond to particular SYs as follows: 2010 Profile for the 2008–2009 SY, 2015 Profile for the 2013–2014 SY, and 2020 Profile for the 2018–2019 SY. The top 20 populated counties in Florida in descending order are Miami-Dade, Broward, Palm Beach, Hillsborough, Orange, Pinellas, Duval, Lee, Polk, Brevard, Pasco, Volusia, Seminole, Sarasota, Manatee, Collier, Osceola, Lake, Marion, and St. Lucie (The Florida Legislature, 2019). The top 20 populated counties were targeted for this investigation as 91.2% of Florida’s population live in urban areas (The Florida Legislature, 2019) and therefore have a higher concentration of students.
For our third research question, we narrowed our search to investigating the largest urban school district in Florida, MDCPS (The Florida Legislature, 2019). In particular, we analyzed the educational placement setting records for all schools within MDCPS over three SYs. Urban school districts generally fall behind in inclusion rates compared to the national average (Author, 2015), as is the case for MDCPS, which reported an inclusion rate of 62% in 2019, compared to the state of Florida, which was 77% and the national average of 64.8% (FLDOE, 2020; USDOE, 2022). During the 2019–2020 SY, MDCPS reported servicing 480 traditional and charter schools with a total student enrollment of 347,069 students in grades PK–12, 11% of whom are SWDs (FLDOE, 2020; MDCPS, 2020). The demographic breakdown of this district is as follows: White Non-Hispanic 6.5%, Black Non-Hispanic 19.5%, Hispanic 72.2%, Other 1.8%, and students on free/reduced lunch 67.8% (MDCPS, 2020). We made a public records request to the commissioner of the FLDOE in December 2020 to access information regarding the educational placement records for all public schools within this school district for the previous three SYs.
Variables
The study variables were composed of three levels: Florida state, the top 20 populated counties, and one large urban county. We manually imported data into SPSS software at the state level to calculate and provide descriptive analysis, trends, and variations in inclusion placement for SWDs in Florida. The main outcome variable in the investigation into the placement trends in inclusion settings was the SWDs (ages 6–21) serviced in the state during the 2019–2020 SY (n = 377,535). Independent variables included eligibility category and race. We extracted data from the FLDOE (2020) child count report. We disaggregated it to determine the percentages of SWDs in the state of Florida (n = 377,535) versus the percentages of students placed in inclusion settings in Florida based on eligibility category and race.
At the county level, we first looked at the total population of K–12 grade students for each of the 20 counties for each of the three years to investigate inclusion trends. We then computed the number of SWDs from the total population and the corresponding percentage of SWDs from the total population. From the number of SWDs, we calculated the percent placed in inclusion for each of the three years. To further examine trends in inclusion, we grouped the counties into counties with a relatively high population of disabilities and counties with a relatively low number of disabilities for the 2020 SY. We calculated the mean disability proportion (.1475) and used .15 as a cutting-off point for high and low disability. The nine low disability counties included: Miami-Dade, Broward, Orange, Pinellas, Lee, Polk, Collier, Osceola, and St. Lucie. The 11 high disability counties included: Palm Beach, Hillsborough, Duval, Brevard, Pasco, Volusia, Seminole, Sarasota, Manatee, Lake, and Marion.
Regarding our third research question, we analyzed data for educational placement of all SWDs in MDCPS by school level for the previous three SYs, 2017–2018, 2018–2019, and 2019–2020. The school levels were elementary (PK–5), middle (6–8), high (9–12), PK–8 centers, charter schools, and alternative settings. PK through 8 schools are institutions that educate students from pre-kindergarten up until 8th grade. Public charter schools are publicly funded schools that can serve students in grades PK–12 and typically operate under a legislative performance contract that affords them more autonomy than traditional public schools (Blazer, 2010; Hussar et al., 2020). Given that charter schools are not required to follow a specific instructional approach and have the flexibility to make their own decisions regarding budgets, class sizes, and staffing (Blazer, 2010), we decided to identify them as a separate school level. Alternative settings refer to school locations that were either juvenile detention centers, alternative education centers, specialized centers (i.e., hospital homebound), or residential centers as the student population for these more restrictive settings fluctuates throughout the SY and usually provides extensive educational services that would not correlate with IE Thus, their data may skew the results of this study.
Data Analysis
This study employed descriptive statistics t-tests as preliminary analyses and General Linear Modeling (GLM) and multilevel analyses as the primary analyses. With preliminary analyses, we examined relationships between the percentage of SWDs in inclusive settings by county with the state’s mean for each year in the study. We used t-tests and GLM to determine if there was any significant difference between the means of various groups (Howell, 2013).
Utilizing education placement data provided by FLDOE (2020) for MDCPS to investigate three SYs, 2017–2018, 2018–2019, and 2019–2020, the study conducted GLM and multilevel analysis to analyze the changes of SWDs varied by school levels. We tallied placement data within five categories: regular class, resource room, special classroom, other separate environments, and the total number of SWDs. As per FLDOE (2020), a regular class consists of SWDs being included within the general education classroom with peers without disabilities for 80% or more of the school week, resource room is inclusion for 40–80% of the school week, special classroom is inclusion less than 40% of the school week, and other separate environments are specialized centers, residential placements, or hospital/homebound placements. For this study, data listed within “regular class” were analyzed as full inclusion data.
First, we coded data for the educational placement of all SWDs in MDCPS by school level. For GLM, coding entailed the following 6 categories: 1 = elementary school, 2 = middle school, 3 = high school, 4 = PK–8 school, 5 = charter school, and 6 = alternative school. The study used the graphical presentations of GLM and compared the SWDs changes over three academic years. We created five dummy coded variables for multilevel analysis, and the charter school served as a reference group school. Taking advantage of the flexibility of multilevel analysis concerning statistical assumptions and applications, we interpreted multilevel outcomes for the initial gaps and growth rates (changes over three years) among different schools. A small number of schools (n < 5) serviced grades 6–12, and they were coded as middle school because that was the starting grade level for that school. We coded the small number of schools (n < 5) that serviced only grades 11–12 as high school.
Results
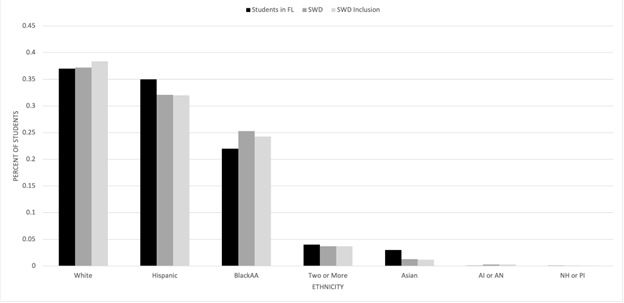
Overall, inclusion rates in the state increased over the ten years reviewed (FLDOE, 2020). The overall inclusion percentage was 64% in 2010, 71% in 2015, and 76% in 2020. To examine the placement trends in inclusion settings at the intersection of disability and race, we disaggregated the data by race to compare the percentages of students enrolled in PK–12 public schools (n = 2,858,949), the percentages of SWDs, ages 6–21 (n = 377,535), and SWDs placed in inclusion settings (n = 285,955; FLDOE, 2020). Florida reported child counts for the 2019–20 SY for SWDs, ages 6–21, under the following seven racial categories: American Indian or Alaskan Native, Asian, Black or African American, Hispanic/Latino, Two or More Races, Native Hawaiian or Other Pacific Islander, and White. The racial demographics showed that most SWDs in Florida and most students in inclusion were White, Hispanic, or Black/African American. In all seven racial categories, the percentages of overall SWDs and the percentages of students in inclusion were significantly similar. Of those three racial and ethnic categories, a visual analysis of the data (Figure 1) shows that White students appear to be identified with a disability at a rate comparable to their overall population but are more likely to be placed in inclusion. Hispanic students are less likely to be identified with a disability, but their placement in inclusion seems comparable to those identified with a disability. Meanwhile, Black students are more likely to be identified with a disability and are less likely to be placed in inclusion.
Figure 1
Comparison by Race for 2019-2020 School Year in Florida Schools
As delineated in Figure 2, during the 2019–20 SY, Florida reported child counts for SWDs, ages 6–21, grouped into 11 eligibility categories. Data indicated that the three main eligibility categories placed in inclusion settings were speech and language impairment (SLI; 93%), SLD (89%), and other health impairments (OHI; 78%). The three eligibility categories with the lowest inclusion rates were autism spectrum disorder (ASD; 40%), dual sensory impairment (21%), and ID (11%).
We also compared the percentage of SWDs (n = 377,535) to the percentage of students placed in inclusion (n = 285,955) by eligibility category, as depicted in Figure 2. The eligibility category with the highest rate of inclusion was SLI. Data showed that a large percentage of SWDs in Florida were identified as having SLD (42%). Of the 42% of students with SLD, 89% were placed in an inclusion setting. The state reported a small population of students in the eligibility category of deaf or hard of hearing (1%), traumatic brain injury (.1%), and visual impairments (.3%). Of these three categories, most students were serviced in inclusion settings. The lowest population category was students with dual sensory impairment (.02%); however, most were serviced in a self-contained setting, meaning inside the regular classroom for less than 40% of the school day.
Figure 2
Students with Disabilities in Inclusion by Eligibility Category 2019-2020 School Year
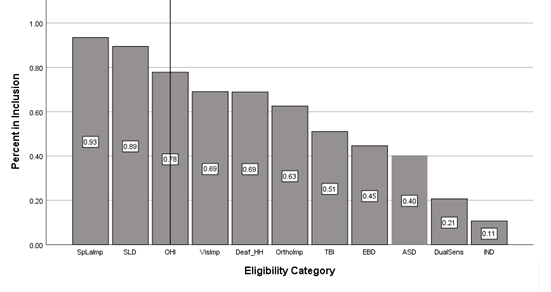
Note. The data for this figure were retrieved from the FLDOE (2020) child count by eligibility category and educational environments in Florida. Key for eligibility category: SpLaImp = Speech and/or Language Impairment, SLD = Specific Learning Disability, OHI = Other Health Impairment, VisImp = Visual Impairment, Deaf_HH = Deaf or Hard of Hearing, OrthoImp = Orthopedic Impairment, TBI = Traumatic Brain Injury, EBD = Emotional/Behavioral Disorder, ASD = Autism Spectrum Disorder, DualSens = Dual Sensory Impairment, IND = Intellectual Disability.
Next, we compared the mean percent of inclusion for Florida's 20 largest counties between 2010, 2015, and 2020 by conducting GLM. The results of the GLM show a significant linear growth pattern (B = .149, F = 29.25, p =.00), indicating that more students were placed in inclusion settings in the 20 largest counties over the ten years. Specifically, these results demonstrate that the state's inclusion rate is increasing.
We conducted an independent-samples t-test to compare the inclusion rate for counties with a low disability rate and counties with a high disability rate for 2020 (Table 2). The nine counties identified as having low rates of disability (M = 0.76, SD = 0.08) compared to the 11 counties identified as having high rates of disability (M = 0.78, SD = 0.06) demonstrated no significant difference in the percent of inclusion for the test year, t(20) = -0.676, p = .51. These results suggest that the average rate of inclusion of high disability counties is not significantly different from that of low disability counties. Specifically, the results suggest that the rate at which schools placed SWDs in inclusive settings was no different in counties with a high number or low number of SWDs.
Table 1
Results of Independent t-tests and Descriptive Statistics for the Year 2020, by High Disability and Low Disability Counties
|
Outcome |
Group |
95% CI for Mean Difference |
|
|
||||||
|
|
Low Disability |
|
High Disability |
|
|
|||||
|
|
M |
SD |
N |
|
M |
SD |
N |
t |
df |
|
|
2020 |
.757 |
.083 |
9 |
|
.778 |
.059 |
11 |
-.088, .045 |
-.676 |
18 |
We conducted three separate Pearson correlation analyses to confirm the relationship between the percentage of students in inclusion settings and the overall SWDs percentage. 2010, 2015, and 2020 showed no correlation between the percentage of students in inclusion settings and the percentage of SWDs for the years evaluated. Thus, a change in percent of SWDs had no effect on the percent of students in inclusion settings (r = .289, p = .216 in 2010; r = .128, p = .590 in 2015; and r = .162, p = .495 in 2020).
Finally, we compiled educational placement information for SWDs from every public school within MDCPS over three SYs. We tallied placement data within five categories: regular class, resource room, special classroom, other separate environments, and the total number of SWDs. Table 3 provides the descriptive statistics for the percent of SWDs placed in inclusion settings in MDCPS for the three SYs investigated. The table shows that MDCPS's mean inclusion rate rose from 64% in 2010 to 76% in 2020.
Table 2
Results of One-sample t-test and Descriptive Statistics for MDCPS Mean Percent of Inclusion and Florida’s Mean Percent of Inclusion for 2010, 2015, and 2020
|
Outcome |
|
M |
SD |
N |
|
Comparison Value |
95% CI |
t |
df |
|
2010 |
|
.648 |
.063 |
20 |
|
64 |
-63.381, -63.322 |
-4530.011** |
19 |
|
2015 |
|
.725 |
.091 |
20 |
|
71 |
-70.318, -70.233 |
-3462.944** |
19 |
|
2020 |
|
.769 |
.070 |
20 |
|
76 |
-84.264, -84.264 |
-5400.092** |
19 |
Note: * indicates significant at 0.05 and ** indicates significant at 0.01
With the same measurement of the educational placement being made every year, we first conducted GLM to compare information from 2017–2018, 2018–2019, and 2019–2020 SYs (Howell, 2013). The graph in Figure 3 shows that in the 2017–2018 year, charter schools had the highest SWDs placed in an inclusion setting, followed by high school, PK–8 schools, middle schools, elementary schools, and alternative schools. While the SWDs growth (change) rate of PK–8 schools, middle schools, elementary schools, and alternative schools increased over the years, charter and high schools did not significantly increase.
Figure 3
Inclusion Percentages by School Level in Miami-Dade County Public Schools
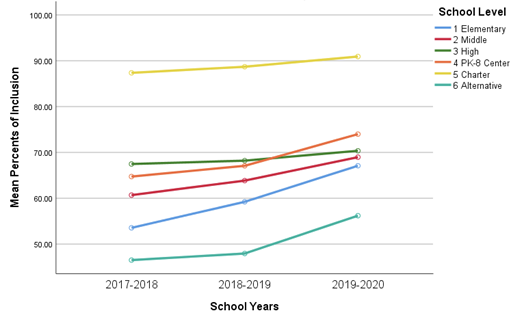
The multilevel analysis results displayed a similar pattern (see Figure 3). The overall charter schools’ SWDs placed in an inclusion setting in 2017–2018 was 86.60%, and the increase rate was 1.67% per year. Compared to charter schools’ SWDs in 2017–2018, other schools had significantly lower SWDs percent: 16.45% lower in high schools, 28.18% lower in PK–8 schools, 30.38% lower in middle schools, 32.16% lower in alternative schools, and 39.79% lower in elementary schools. Elementary, middle, and PK–8 schools showed a significantly faster growth rate than charter schools’ growth rate of SWDs placed in an inclusion setting for the years examined. High schools and alternative schools’ growth rate of SWDs placed in inclusion did not change for the years examined.
Discussion
The growing prevalence of inclusion across the United States is the result of federal laws and mandates calling for such action (Goodman et al., 2011; Kirby, 2017; Pak & Parsons, 2020; Voulgarides, 2022; Williamson et al., 2020). Per IDEA (2004), all states must report yearly data regarding SWDs, including educational environment placements, disability categories, and race/ethnic background information (Gilmour, 2018; Grindal et al., 2019). Taking a perspicacious look at Florida, we first examined it as a whole. Concerning inclusion placement trends for SWDs within the eligibility category, based on the child counts provided by Florida for the 2019–20 SY, we could discern that students with SLI, SLD, or OHI were more likely to be serviced within inclusion settings. These findings correlated with a study by Goodman et al. (2011), which indicated that students with mild disabilities are most often placed in inclusion classrooms. The disability categories less likely to be serviced within an inclusion setting were EBD, ASD, dual sensory impairment, and ID. These lower rates of inclusion may be attributed to these students' extensive academic and behavioral needs, as suggested by Gilmour’s (2018) finding that students with greater learning and behavioral needs are often placed in more restrictive special education settings. It is important to note that schools placed 40% of students with ASD in inclusion and 43% in self-contained settings; therefore, they have similar placement rates in those educational environments. The findings correlated with the assumption made by Kirby (2017), as well as studies carried out by McLeskey et al. (2012) and Williamson et al. (2020), that the majority of students with SLD are educated in inclusion settings. The Florida demographics for SWDs revealed that 89% of students with SLD were placed in inclusion during the 2019–20 SY (FLDOE, 2020).
As for inclusion placement trends for SWDs based on race, the Florida child counts reflected that White, Hispanic, or Black/African American students accounted for the majority of SWDs during the 2019–20 SY. Differences between students identified with a disability and those placed in inclusion were found based on race. Our findings show that White students are proportionately less likely to be identified with a disability and more likely to be placed in inclusion compared to Black students. These findings are consistent with Grindal et al.’s (2019) study, which found that racial disparities persist in special education identification and placement decisions.
Next, we examined the 20 most populated counties in Florida. Our results show that the mean percent of SWDs (ages 6–21) serviced in inclusion settings in the 20 most populated counties in Florida surpassed Florida’s overall mean inclusion rate for all three SYs. These findings show that Florida’s rate of inclusion is rising, and by extension, we can conclude that RELD’s SWDs inclusion rates are increasing as well. Our findings show that this is a positive change from Author’s 2014 study that found that RELD students in special education are more likely to be serviced in separate settings. Yet, it is essential to note that Florida’s inclusion rate of 77% for the 2019–2020 SY is still far from meeting the 2020 goal set by the SEA of 85% inclusion (FLDOE, 2020).
This study found that the average inclusion rate of high disability counties is not significantly different from that of the low disability counties. It is, however, noteworthy that of the top five populated counties in Florida, three of the five counties are grouped as low disability, counties with a relatively low number of disabilities for the 2020 SY. It would be interesting to examine the labeling practices of these counties further since, despite their population, they have fewer students with disabilities compared to other counties. Specifically, Miami-Dade, the most populated county in Florida, had the lowest inclusion rate in 2020 (M = .57), while Broward, its neighboring county and the second largest in the state, had one of the highest inclusion rates (M = .82). Although MDCPS has come a long way since first implementing a district wide inclusion policy in 2004 (Watnick & Sacks, 2006), the district still is behind national, state, and goal averages. Future research should more deeply examine MDCPS’s challenges at the intersection of poverty and racial and ethnic diversity to understand inclusion practices.
Lastly, we chose to analyze the inclusion rates for all public schools within MDCPS because of its diverse population and size. Our analysis of inclusion rates for SWDs in general education classrooms showed that secondary schools (i.e., middle and high) have higher rates than elementary schools, which complements the studies conducted by McLeskey et al. (2012) and Williamson et al. (2020). The NCES reported a considerable increase in charter school enrollment from 0.4 million to 3.1 million between 2000 and 2017 (Hussar et al., 2020); therefore, a review of their inclusion trends was incorporated in this study. In a review of traditional public and charter schools, Blazer (2010) reported that charter schools typically serve a lower proportion of SWDs. This may explain why our analysis reflected significantly higher inclusion rates in charter schools. As shown in Figure 3, our analysis also revealed significantly higher inclusion rates at PK–8 schools compared to elementary and middle schools combined. We hypothesized that these two groups would have similar inclusion rates because they serve the same grade levels. Further research into why the inclusion difference is so significant is warranted.
Limitations and Suggestions for Future Research
This study has many limitations. This study did not investigate the actual practices that would help us understand why some counties have higher disability and inclusion rates than others. Further, this study used data reported by each county in Florida. It would be helpful to examine raw data to more clearly understand the inclusion trends. Additionally, during data analysis for our third question, we observed that most alternative schools, settings that are by default segregated as they only serve students with disabilities, did not report data despite meeting the criteria for data reporting (i.e., schools with at least 10 SWDs) and were therefore not factored into the inclusion rate of the state. Furthermore, it is worthy to note there is a discrepancy in some of the reported means of inclusion each year, which may be due to the inclusion or exclusion of alternative schools and private schools. Without accurate data from all educational settings where SWDs are serviced, we must interpret the results of our analysis with caution.
As this research shows, inclusion rates vary significantly by county. As mentioned above, we recommend a future examination of neighboring counties with similar population demographics, such as Broward and Miami-Dade counties. Broward’s inclusion rate rose above Florida’s average (77%) and closer to Florida’s goal (85%) during the 2019–2020 SY (FLDOE, 2020). Another aspect of inclusion that researchers should consider examining is the differences in inclusion rates in elementary and middle schools compared to K–8 schools. These two groups serve the same age group, yet K–8 centers consistently have a higher inclusion rate, as evidenced by this study.
Similarly, future research might further magnify disability rates and inclusion practices by looking at differences in zip codes within a highly populated, urban county. Another consideration might be investigating the inclusion practices of high-poverty neighborhoods compared to low-poverty communities. Sullivan and Artiles (2011) suggest disproportionality is often higher in low-poverty neighborhoods and that special education services are used as a method of segregation. Taking a closer look at the inclusion practices at the county, school, and zip code level can better help us understand how where SWDs live can impact their chances of being in an inclusive setting.
Furthermore, teachers can play a vital role in the success of inclusive practices. Future research should examine teachers' attitudes toward inclusion and how they view their preparedness to work with SWDs (van Steen & Wilson, 2020). It would be helpful to examine the professional development and preservice teacher training that prepares teachers to meet the needs of diverse learners. Van Mieghem et al. (2020) point out that professional development of evidence-based practices for IE is necessary for inclusion success.
Conclusion
Using Florida as a state-level case study, this study focused on three main areas: inclusion placement trends that exist based on disability category and race in public schools, inclusion rates in the 20 most populated counties compared to the state’s mean of inclusion, and inclusion variations across all public-school levels in one large, urban school district. Our findings show that the highly populated counties reported higher inclusion rates each year than the state. We also found that despite more students being placed in inclusion each year, inclusion rates vary by disability category, race, county, and school level and type.
Our study found that a student’s chance of being placed in inclusion depends on many factors such as their disability, race, in which county they live, their grade level, and the type of school they attend. Many students who fall on the wrong side of any of these factors are excluded and segregated from their peers, at first in an educational setting and later in society. We must further examine the placement of students in inclusion to ensure that all students have an equitable chance of being an inclusive member of our society.
References:
Artiles, A., J., Kozleski, E. B., Dorn, S. & Christensen, C. (2006). Learning in inclusive education research: Re-mediating theory and methods with a transformative agenda. Review of Research in Education, 30(1), 65–108. https://doi.org/10.3102/0091732X030001065
Author. (2014). Placement and achievement of urban Hispanic middle schoolers with specific learning disabilities. Journal of Urban Learning, Teaching, and Research, 10, 3–13. https://files.eric.ed.gov/fulltext/EJ1044123.pdf
Author. (2015). Shifting least restrictive environments in a large urban school district. Journal of Urban Learning, Teaching, and Research, 11, 40–49.
Blanchett, W. J., Klingner J. K., Harry, B. (2009). The intersection of race, culture, language, and disability: Implications for urban education. Urban Education, 44(4), 389–409. https://doi.org/10.1177/0042085909338686
Blazer, C. (2010). Literature review: Research comparing charter schools and traditional public schools. Research Services Offices of Assessment, Research, and Data Analysis. Miami-Dade County Public Schools. http://drs.dadeschools.net/AdditionalReports/Charter_vs_Traditional_School.pdf
Broward County Public Schools. (2017). Support facilitation model - Effective inclusion: A collaborative process. Exceptional Learning Support Division.
Choi, J. H., McCart, A. B., & Sailor, W. (2020). Reshaping educational systems to realize the promise of inclusive education. Forum for International Research in Education, 6(1), 8–23. https://doi.org/10.32865/fire202061179
Cole, S. M., Murphy, H. R., Frisby, M. B., Grossi, T. A., & Bolte, H. R. (2021). The relationship of special education placement and student academic outcomes. Journal of Special Education, 54(4), 217–227. https://doi.org/10.1177/0022466920925033
Dev, P., & Haynes, L. (2015). Teacher perspectives on suitable learning environments for students with disabilities: What have we learned from inclusive, resource, and self-contained classrooms? The International Journal of Interdisciplinary Social Sciences: Annual Review, 9, 54–64.
Every Student Succeeds Act of 2015 [ESSA]. (2015). https://www.ed.gov/essa?src=rn
Fish, R. E. (2019). Standing out and sorting in: Exploring the role of racial composition in racial disparities in special education. American Educational Research Journal, 56(6), 2573–2608. https://doi.org/10.3102/0002831219847966
Florida Department of Education. (2017). Class placement by category, ages 6–21, 2017–18 [Data set]. Bureau of Exceptional Student Education and Student Services.
Florida Department of Education. (2018). Class placement by category, ages 6–21, 2018–19 [Data set]. Bureau of Exceptional Student Education and Student Services.
Florida Department of Education. (2019). Class placement by category, ages 6–21, 2019–20 [Data set]. Bureau of Exceptional Student Education and Student Services.
Florida Department of Education. (2020). 2020 SEA profile Florida. Bureau of Exceptional Student Education and Student Services. http://www.fldoe.org/core/fileparse.php/7602/urlt/SEAProfile20.pdf
Florida Department of Education. (2020). LEA profiles archives. Bureau of Exceptional Student Education and Student Services. http://www.fldoe.org/academics/exceptional-student-edu/data/lea-profiles/
Florida Department of Education. (2020). SEA and LEA profiles 2020. Bureau of Exceptional Student Education and Student Services. https://www.fldoe.org/academics/exceptional-student-edu/data/
Florida Department of Education. (2020). Child count by eligibility category and educational environment, ages 6–21, 2019–20 [Data set]. http://www.fldoe.org/core/fileparse.php/7672/urlt/Ages6-21CCEligEdEnv1920.pdf
Florida Department of Education. (2020). Child count by race and educational environment, ages 6–21, 2019–20 [Data set]. https://www.fldoe.org/core/fileparse.php/7672/urlt/Ages6-21CCRace-Elig1920.pdf
Friend, M. (2015). Welcome to co-teaching 2.0. Educational Leadership, 73(4), 16–22.
Gatlin, B. T., & Wilson, C. L. (2016). Overcoming obstacles: African American students with disabilities achieving academic success. Journal of Negro Education, 85(2), 129–142. https://doi.org/10.7709/jnegroeducation.85.2.0129
Giangreco, M. F. (2020). “How can a student with severe disabilities be in a fifth-grade class when he can’t do fifth-grade level work?” Misapplying the least restrictive environment. Research & Practice for Persons with Severe Disabilities, 45(1), 23–27. https://doi.org/10.1177%2F1540796919892733
Gilmour, A. F. (2018). Has inclusion gone too far? Weighing its effects on students with disabilities, their peers, and teachers. Education Next, 8–16. https://eric.ed.gov/?id=EJ1191012
Goodman, J. I., Hazelkorn, M., Bucholz, J. L., Duffy, M. Lou, & Kitta, Y. (2011). Inclusion and graduation rates: What are the outcomes? Journal of Disability Policy Studies, 21(4), 241–252. https://doi.org/10.1177/1044207310394449
Grindal, T., Schifter, L. A., Schwartz, G., & Hehir, T. (2019). Racial differences in special education identification and placement: Evidence across three states. Harvard Educational Review, 89(4), 525–553. https://doi.org/10.17763/1943-5045-89.4.525
Howell, D. C. (2013). Statistical methods for psychology. Wadsworth, Cengage Learning.
Hussar, B., Zhang, J., Hein, S., Wang, K., Roberts, A., Cui, J., Smith, M., Bullock Mann, F., Barmer, A., & Dilig, R. (2020). The condition of education 2020 (NCES 2020-144). US Department of Education, National Center for Education Statistics. https://nces.ed.gov/pubs2020/2020144.pdf
Individuals with Disabilities Education Improvement Act of 2004 [IDEA]. (2004). https://sites.ed.gov/idea/statuteregulations/
Kirby, M. (2017). Implicit assumptions in special education policy: promoting full inclusion for students with learning disabilities. Child and Youth Care Forum, 46(2), 175–191. https://doi.org/10.1007/s10566-016-9382-x
McLeskey, J., Landers, E., Williamson, P., & Hoppey, D. (2012). Are we moving toward educating students with disabilities in less restrictive settings? Journal of Special Education, 46(3), 131–140. https://doi.org/10.1177/0022466910376670
Miami-Dade County Public Schools. (2020). Statistical highlights 2019–2020: M-DCPS student membership. http://drs.dadeschools.net/StatisticalHighlights/SH1920.pdf
National Center for Education Statistics (2019). Percentage distribution of students 6 to 21 years old served under IDEA (No. 204.60). U. S. Department of Education, Digest of Education Statistics. https://nces.ed.gov/programs/digest/d18/tables/dt18_204.60.asp
National Council on Disability (2018). IDEA series: The segregation of students with disabilities. https://ncd.gov/sites/default/files/NCD_Segregation-SWD_508.pdf
Pak, K. & Parsons, A. (2020). Equity gap for students with disabilities. Penn GSE Perspectives on Urban Education, 1–13. https://eric.ed.gov/?id=EJ1251597
Skrtic, T., Saatcioglu, A., & Nichols, A. (2021), disability as status competition: The role of race in classifying children. Socius: Sociological Research for a Dynamic World, 7, 1–20. https://doi.org/10.1177/23780231211024398
Sullivan, A., & Artiles, AJ. (2011). Theorizing racial Inequity in special education: Applying structural inequity theory to disproportionality. Urban Education, 46(6) 1526–1552. https://doi.org/10.1177/0042085911416014
The Florida Legislature. (2019). The Florida legislature econographic news. Economic and Demographic News for Decision Makers, 1, 1–3. Office of Economic and Demographic Research. http://edr.state.fl.us/content/population-demographics/reports/econographicnews-2019v1.pdf
The Florida Legislature. (2019). Florida: An economic overview focusing on county differences. Office of Economic and Demographic Research http://edr.state.fl.us/Content/presentations/economic/EconomicOverviewFocusingonCounty%20Differences.pdf
United States Census Bureau. (2021). Urban areas facts. https://www.census.gov/programs-surveys/geography/guidance/geo-areas/urban-rural/ua-facts.html
United States Department of Education. (2022). 43rd Annual report to congress on the implementation of the Individuals with Disabilities Act, 2021. Office of Special Education and Rehabilitative Services, Office of Special Education Programs. https://sites.ed.gov/idea/files/43rd-arc-for-idea.pdf
van Mieghem, A., Verschueren, K., Petry, K., & Struyf, E. (2020). An analysis of research on inclusive education: A systematic search and meta review. International Journal of Inclusive Education, 24(6), 675–689. https://doi.org/10.1080/13603116.2018.1482012
van Steen, T., & Wilson, C. (2020). Individual and cultural factors in teachers’ attitudes towards inclusion: A meta-analysis. Teaching and Teacher Education, 95. https://doi.org/10.1016/j.tate.2020.103127
Voulgarides, C. K. (2022). The promises and pitfalls of mandating racial equity in special education. Phi Delta Kappan, 103(6), 14–20. https://doi.org/10.1177/00317217221082804
Watnick, B., & Sacks, A. (2006). A snapshot of teacher perceptions on full inclusion in an international urban community: Miami-Dade County, Florida. The Journal of The International Association of Special Education, 7(1), 67–74.
Williamson, P., Hoppey, D., McLeskey, J., Bergmann, E., & Moore, H. (2020). Trends in LRE placement rates over the past 25 years. Journal of Special Education, 53(4), 236–244. https://doi.org/10.1177/0022466919855052